2025 ahead ayondo Franchise coming soon
Happy  xMas Holidays
In this section, we provide users of our information portal with a further, now very extensive option for carrying out research and analyses on listed companies. The module offers a wide range of setting options as well as a number of useful additional features that make your work easier when analyzing companies. You also save valuable time, as further information is just a click away.
The intelligent search function allows you to search by WKN, ISIN, symbol or the name of the company. The database is constantly being expanded. If you would like to refer to a specific chart, you are welcome to use the short URL provided. With one click you can copy it to the clipboard and link it via e-mail or social media. The integrated AI provides you with further information on the individual companies. Simply click on the small OpenAI symbol and wait for the result of the AI analysis. Tip: Switch to the *Advanced version* to display the professional view of the charting.
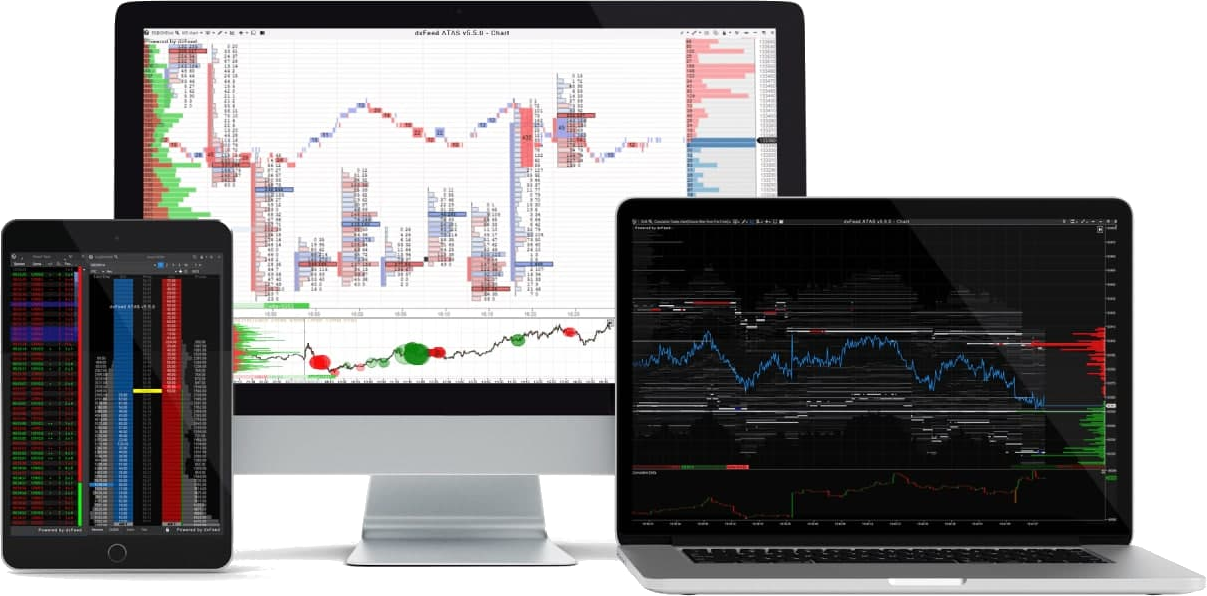
Trading Solutions for Professionals
At the moment it is not possible to render the historical price development in the form of a chart. There may be various reasons for this, such as a delisting due to a takeover or stock market withdrawal. But don't worry: alternative sources for further research are available to you via the stock exchange symbol, TV icon or the button panel below the chart window. For delistings or ISIN/ticker changes, you may find what you are looking for here.
Use our new 'Get Notified' Alert Service
Need even more analytics power, real-time data and more? Then click here to find out.
The share price data shown in the chart is end-of-day* (EoD) information that provides an initial visual indication of trends and developments. Further insights can be gained from the share price performance, which can be incorporated into the assessment of a company's possible future share price and thus value development. The tool provided here and all additional features can be included in further research. The wide range of functionalities enable the findings to be validated using additional sources. Clicking on the company logo will take you to the website of the listed company.
*Real-time share price information is generally subject to a charge.