Company Profile & Technical Analysis *advanced*


Trading Solutions for Professionals
- 25 kinds of clusters
- 26 world exchanges
- 14 different charts
- 58 necessary for analysis indicators
- 50+ customized templates for charts
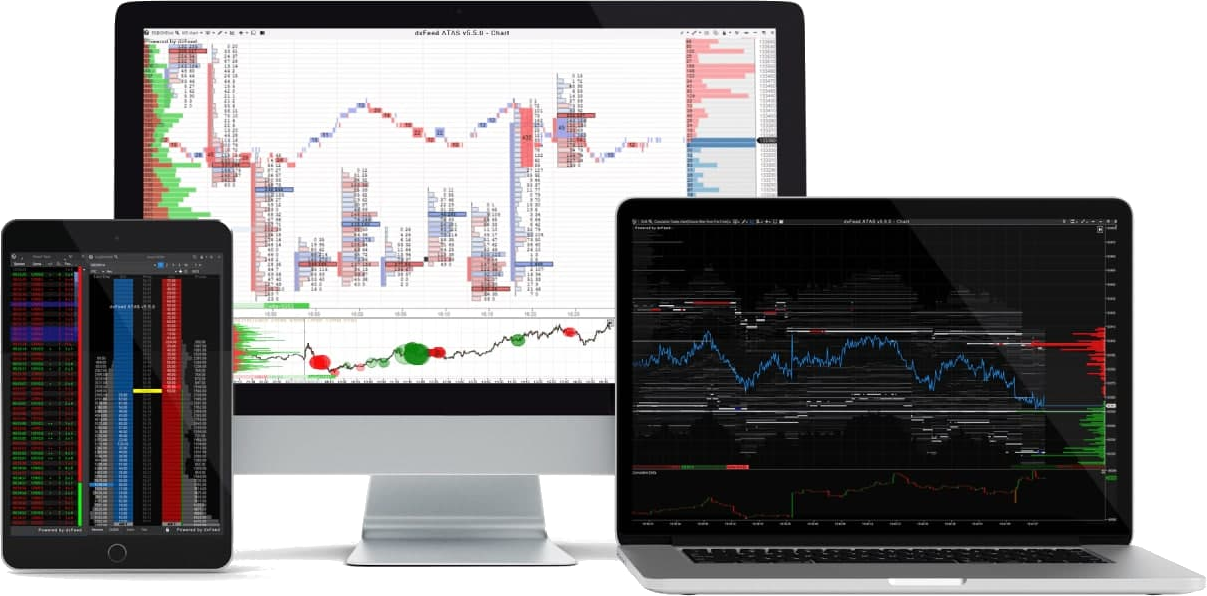
Get your free Demo today
RNS News: Temporary or possibly permanent suspension of the stock exchange listing.
At the moment it is not possible to render the historical price development in the form of a chart. There may be various reasons for this, such as a delisting due to a takeover or stock market withdrawal. But don't worry: alternative sources for further research are available to you via the stock exchange symbol, TV icon or the button panel below the chart window. For delistings or ISIN/ticker changes, you may find what you are looking for here.

Use our new 'Get Notified' Alert Service
OPINION MINER
- coming soon-
Need even more analytics power, real-time data and more? Then click here to find out.
The share price data shown in the chart is end-of-day* (EoD) information that provides an initial visual indication of trends and developments. Further insights can be gained from the share price performance, which can be incorporated into the assessment of a company's possible future share price and thus value development. The tool provided here and all additional features can be included in further research. The wide range of functionalities enable the findings to be validated using additional sources. Clicking on the company logo will take you to the website of the listed company.
*Real-time share price information is generally subject to a charge.
