Boiron S.A.
WHO'M
ai
Digital Profiler. Simply click the AI button
FIGI: BBG000BF2ZC0
BOI
Boiron S.A.
GICS: 35202010
·
Sector: EQTY
·
Sub-Sector: -
NAME
Boiron S.A.
ISIN
FR0000061129
TICKER
BOI
MIC
XPAR
REUTERS
BOIR.PA
BLOOMBERG
BOI FP
F&G:
36
Financial Intelligence
FOR INVESTORS
FOR TRADERS
Securities Trading
Warrants
smart.AD

Trading Solutions for Professionals
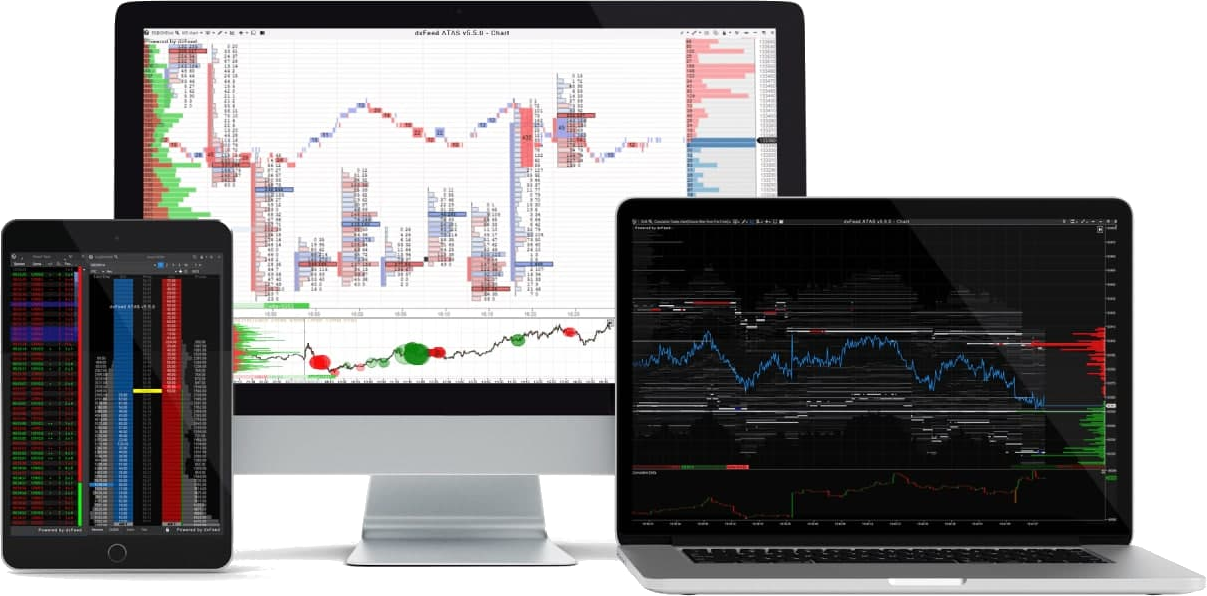
- 25 kinds of clusters
- 26 world exchanges
- 14 different charts
- 58 necessary for analysis indicators
- 50+ customized templates for charts
Get your free Demo today
At the moment it is not possible to render the historical price development in the form of a chart. There may be various reasons for this, such as a delisting due to a takeover or stock market withdrawal. But don't worry: alternative sources for further research are available to you via the stock exchange symbol, TV icon or the button panel below the chart window. For delistings or ISIN/ticker changes, you may find what you are looking for here.
BOI
Information on product placements


